
A primary objective of AIOps is shifting from reactive to proactive operations by anticipating business impacting issues before they spiral out of control. Anomaly detection is a component of AIOps that mines your system data for patterns and insights in near real-time using machine learning algorithms that adapt as your environment shifts. Broadcom AIOps solutions embed algorithms specifically trained for the mainframe, helping you to drive automated corrective action based on years of mainframe expertise.
The mainframe generates an abundant amount of operational data, and issuing alerts based on all this data is the easy part. But narrowing it down to a useful subset of actionable alerts that really matter is much harder. In part one of my blog series, we took an in-depth look at the various metrics generated by the mainframe. In this blog, we'll drill down into how Broadcom Mainframe AIOps solutions analyze all those metrics and generate meaningful and actionable insights by filtering out irrelevant data and deciphering normal versus abnormal behaviors, based on your unique environment and business objectives.
The below diagram describes the flow of how a metric observation passes through multiple phases to generate an alert. We will step through each phase in detail.
-4.png?width=700&name=unnamed%20(1)-4.png)
6. Collect metrics at a scale
We start with collecting metrics from a variety of sources. The mainframe generates a broad range of metrics - from LPAR-wide to subsystem and down to the transaction level. You need an AIOps solution that can scale to collect and transmit the exponentially growing number of mainframe metrics to provide a real-time pipeline. Mainframe SMF (System Management Facility) records are one source of useful metrics. In addition, there are numerous infrastructure monitoring solutions like SYSVIEW® Performance Intelligence, Vantage™ Storage Intelligence, NetMaster® Network Intelligence and Dynamic Capacity Intelligence which provide very rich metrics. These metric sources are often more actionable because they provide metrics at minute intervals, whereas SMF records are normally taken at fifteen minute intervals.
5. Mathematically Abnormal Events
The metrics are passed through the machine learning modules in near real time. Unsupervised anomaly detection algorithms such as KDE (Kernel Density Estimation) help the system continually learn the metric behavior to determine what’s “normal”. The incoming metric observations are evaluated against the prediction bands to identify the abnormal events. Based on history, the algorithm predicts the ‘base line’.
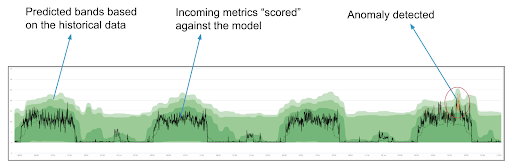
Anomalies have many shapes and sizes, and they’re not limited to short-term deviations. Some anomalies manifest themselves as slow, yet significant, departures from some the usual average.
4. Graded anomalies
In this phase the abnormal events are assigned an anomaly score on a scale of 0-100. A higher score represents a higher abnormality. Using this simple anomaly score, you can subscribe to anomalies that you want to see based on your unique environment and business needs.
3. Alerts
Not every anomaly is interesting. Anomaly detection doesn’t understand anything about your systems. It just understands your definition of unusual or abnormal values. It is important to recognize that the anomaly in the metric that we are observing is not the same as the condition in the system that produced the metric. Here are some common approaches to filter out anomaly noise:
Keep in mind that the map is not the territory: the metric isn’t the system, and an anomaly isn’t a crisis. For example, a spike in transaction rate for CICS is not necessarily a problem if we have capacity. The ability to match one or more anomalies to known patterns provides better quality alerts.
2. Issues
In order to identify the problem, you may need to look at multiple metrics, stack them up and compare them to find patterns. It takes too long to detect manually. This phase uses a machine learning technique called ‘clustering’ to automate this process of discovering natural groupings of alerts which are consistent, coherent and occur in near neighboring time.
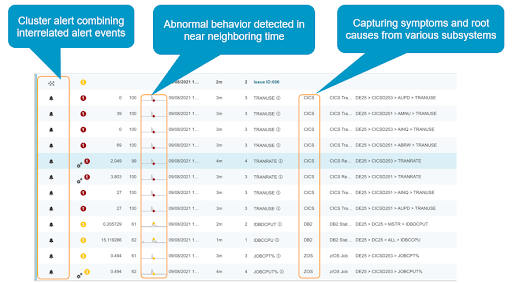
The image above shows an example of clustering CICS, Db2 and system alerts into a single group or issue.
1. User interface
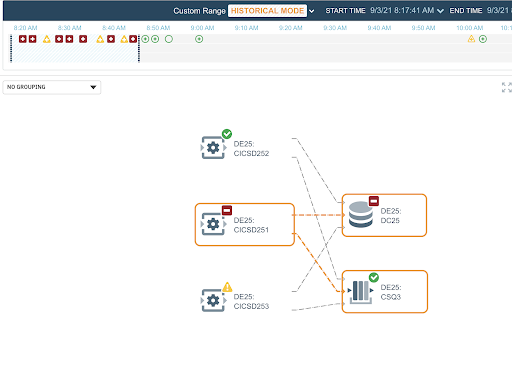
Users of anomaly detection are typically level one operators. These users should not have to spend enormous amounts of time to understand the anomaly. They need an easy way of configuring what anomalies they would like to see. The ability to configure notifications and kickoff the automation by integrating into existing IT landscape is required. The image below illustrates using a topology view to easily locate the alerting service.
Not all metrics have the same importance. For example, instead of detecting anomalies on ‘storage group allocation percentage’ metric, it will be more valuable to alert on ‘rate of consumption’." You want to get notified when it is going to be filled up, providing time on the clock to address the possible situation.
The predictive algorithms should cause an ‘alert’, or better described as AI-to-human communication… “Hey human, no need for an interrupt right now, but I just wanted to tell you the rate of consumption has changed recently. If this continues in this fashion, we may have a problem soon. I will keep an eye on it and generate a real alert when it is time.”
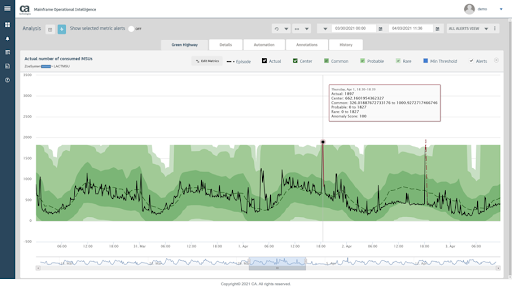 Number of MSUs spiked twice this month
Instead of looking at individual anomalies, sometimes it’s easier to spot the deviation when you stack multiple subsystems and perform the ‘outlier detection’, for example transaction rate across CICSPlex. To detect a more complicated problem, you might need to relate the system behavior to a known model, for example correlating MSU consumption with the CICS transaction rate anomaly.
Domain knowledge and expertise can often play an important role in determining if a sudden change in a metric is expected or is an anomaly. Real-time feedback on the relevance of the detected anomalies, enables a powerful human-in-the-loop mechanism.
We’ve partnered closely with our customers to better understand their unique mainframe environments. They’ve shared their experiences, and even their data, enabling us to fine-tune our machine learning algorithms and increase the ability for you to customize your AIOps approach, so that you are only alerted on the issues that matter to your business.
I encourage you to try out our anomaly detection capabilities against your mainframe data, visit Mainframe AIOps to talk with one of our experts, or reach out to me directly. Checkout our AIOps mini-series to learn more about how Mainframe AIOps solutions from Broadcom can help you get ahead of the curve and more proactively manage your mainframe operations.
Comments