
As IT environments become increasingly complex, more and more organizations are turning to AIOps to help them keep up with growing demands by shifting from reactive to proactive operations.
Anomaly detection is a primary component of AIOps, enabling operators to quickly and automatically spot potential problems in complex IT systems. These complex hybrid IT environments often include the mainframe, so it's important that you have monitoring and alerting capabilities with an end-to-end reach, inclusive of the mainframe. Likewise, setting up the right alerts is also crucial, otherwise you end up with alert fatigue.
This first blog in our two-part series provides an in-depth discussion of the various mainframe operational metrics that can be combined with machine learning algorithms to monitor complex hybrid systems and more proactively detect performance anomalies. Part two of this blog series discusses how all this data is processed to help you focus in on the actionable alerts that really matter to your business.
Anomaly detection uses numerous types of data such as metrics, event logging, distributed tracing as well as application and system logging. Some of the typical challenges associated with anomaly detection include:
These challenges surface the need for an algorithmic approach to anomaly detection.
Anomaly detection identigies when a metric is behaving differently than it has in the past, taking many factors into acount. Setting up alerts with both high precision and good coverage can be challenging, particularly on the mainframe, where the metrics can vary quite dramatically. Below are some examples of these variations:
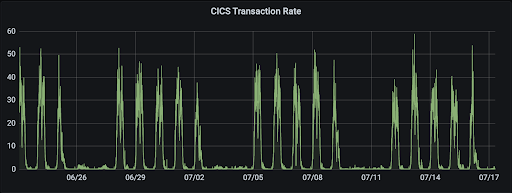
There are metrics that are considered seasonal. A seasonal metric pattern could take place month over month, week over week or within a day. For example, the diagram below shows how a CICS transaction might product a seasonal metric pattern, executing in the daytime, with less activity on weekends and nights.
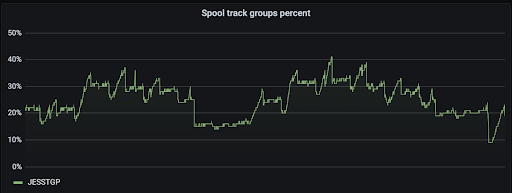
Some metrics gradually increase before hitting a threshold. JES Spool track percentage often gradually increases before declining; and you can't let that run out, or work will stop.
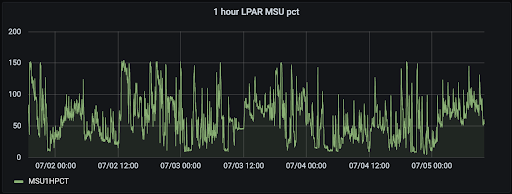
We also have metrics that are noisy. For example, metrics that track the use of CPU time or real storage during the execution of a job can vary randomly.
Some metrics are 'stepwise', The use of SQA storage during a job, reflecting tiered levels of high and low urgency. The following example shows a log copy ring percentage metric for MQ Queue manager.
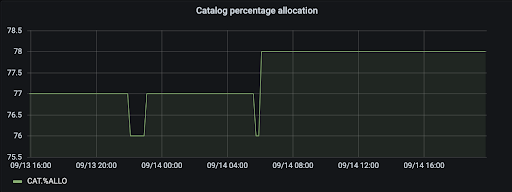
Many times we collect the metrics whenever a workload runs. For example, wait count for a Db2 package is collected whenever packages are executed; they are 'sparse' in nature. There are also metrics which remain 'stationary' most of the time but spiking occasionally. Longer run upward and downward 'trends' can also be seen.
As you can see, mainframe metrics have varying patterns and intervals, each needing to be treated differently when it comes to detecting a meaningful anomaly.
In addition, what defines an anomaly (or irregularity) can also be quite subjective. For example, you may want to filter out small fluctuations as "noise" even though they are marked as anomalies by the rules defined in your system.
To incorporate these metric variations and other unique nuances as to what constitutes an alert, we've been partnering closely with our mainframe customers and industry experts to continuously enhance our mainframe AIOps anomaly detection algorithms to provide you more flexibility in customizing the alerting behavior based on your specific system and business needs. Be sure and check out part two of my blog series, Identifying Alerts that Matter, for an in-depth discussion on how a metric observation passes through multiple phases to produce meaningful and actionable anomalies.
Using a pragmatic approach to deploy AIOps you can begin gaining value quickly using your existing solutions. Watch our four-part AIOps mini-series to learn more about how you can get ahead of the curve and be more proactive in your operations. We invite you to try out our anomaly detection capabilities against your own mainframe data. Visit Mainframe AIOps to talk with one of our experts, or reach out to me directly for more information.
Comments