
As a freight train approached East Palestine, Ohio, a railroad track side sensor alerted the crew that one of its wheel bearings had reached a critical temperature. The engineer immediately attempted to stop the train, but unfortunately, this corrective action was taken too late. On the evening of February 3rd, 2023, dozens of train cars derailed and many exploded—some carrying hazardous materials.
Later analysis by the NTSB revealed that a combination of sparse sensors and policies for interpreting that sensor data were likely contributors to the derailment. The trackside sensor that alerted the crew reported a critical temperature—but too late. Another trackside sensor (19 miles earlier) had also sensed an increased wheel temperature, but the increased wheel temperature did not exceed the train operator’s policy (alarm thresholds) for notifying the crew.
Hindsight is 20/20, and it is often easy to recognize trends in signals like this after the fact. Similarly, in this case, it is tempting to conclude that this derailment was preventable and that incorrect assessment of hot bearing detector sensor data was primarily to blame. However, trying to discern when a signal or metric is problematic in real time is often quite difficult.
As people who are often in the situation needing to be aware of problems, and as people who are also often responsible for crafting and maintaining systems to detect and report those problems, I think we can all understand the positions of both the train engineer and the railroad operators in this case.
Most of us have responsibility for complex systems and applications—perhaps not freight trains—but systems which, if they are not operating properly, cause very real consequences when they fail. Credit card processing, utility operations, network integrity, loan approvals, insurance quotes, train wheel bearing temperatures, etc. Stewards of these systems, just like railroad engineers, need to be able to determine if these systems are healthy. And, if not, why not? Assessing the health of these systems often involves processing and analyzing log, metric, and trace data.
In IT operations, we have been analyzing this data for many years now in the form of alerts and dashboards. Mainframe, distributed, and hybrid cloud “spaces” each have tools and methodologies that facilitate deep visibility into systems and applications. In recent years, there has been an explosion of tools in the distributed and cloud spaces. However, as applications cross these “space” boundaries, it becomes increasingly difficult to maintain end-to-end visibility without requiring people to use many different tools and without drawing upon diverse sets of skills. In short, we are suffering from fractured tools, increasing application complexity, and a lack of end-to-end visibility. That is particularly true when hybrid applications include the mainframe. More on the mainframe in a bit…
OpenTelemetry is a Cloud-Native Computing Foundation (CNCF) project that seeks to wrap specifications, conventions, and methodology around processing log, metric, and trace data (aka telemetry signals) to better facilitate the visibility of computing system health. The standards-based processing allows participating vendors to plug into these streams of telemetry signals and provide the visibility we need to keep the systems on which critical applications run healthy. The high-level processing model for OpenTelemetry looks like this:
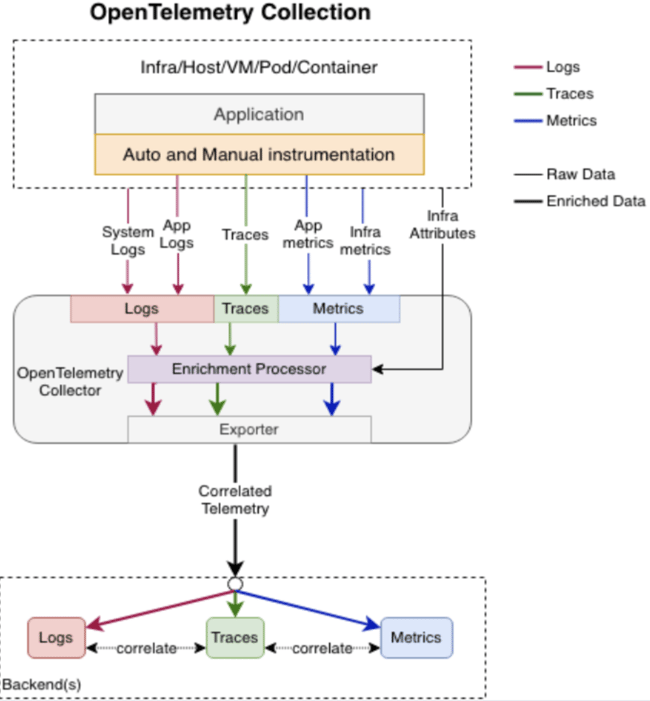
(Source: https://opentelemetry.io/docs/specs/otel/logs/ )
We’ll save the technical details of OpenTelemetry for later blog posts (in the meantime, those details are covered quite well elsewhere on the internet), but at a high level, OpenTelemetry provides customers increased choice, increased agility, reduced vendor lock-in, shorter time to value, and better visibility.
That sounds great! But, what about the mainframe?
The mainframe is an extremely visible platform—I would argue that the mainframe offers some of the deepest visibility of any system on the planet. We have logs—SYSLOG, OPSLOG, log streams, LOGREC, and more—hundreds of different SMF records communicating events and metrics, dumps, GTF Traces, component traces, SYSTRACE, etc. The mainframe also has many commercially available products, such as SYSVIEW, NetMaster, and Vantage, that add to that already rich set of telemetry. The mainframe is a great place for a nerd like me. But for application owners outside the mainframe ecosystem, the mainframe can be a daunting place if their applications rely on components running on the mainframe.
The OpenTelemetry project has made a lot of progress in a few short years, but it is still in the early innings in our estimation. At Broadcom’s Mainframe Software Division, we feel that this is an opportune time for the mainframe ecosystem to embrace OpenTelemetry. And we have begun working toward that goal.
First, we’re currently participating in some of the OpenTelemetry specification sub-workgroups to engage with the community and bring our mainframe point of view to the table.
In addition, Broadcom has been experimenting with some OpenTelemetry integrations in-house, and the results so far are very promising. We have demonstrated some of these integrations at recent conferences. At the SHARE conference in March 2023, we demonstrated the ability of our SYSVIEW Option for CICS to recognize and propagate OpenTelemetry instrumented trace signals for CICS transactions. In addition, we demonstrated the ability to export metrics from SYSVIEW, Vantage, NetMaster, and SYSVIEW for DB2. Finally, we demonstrated exporting those resulting trace spans and metrics to multiple back-ends via OpenTelemetry.
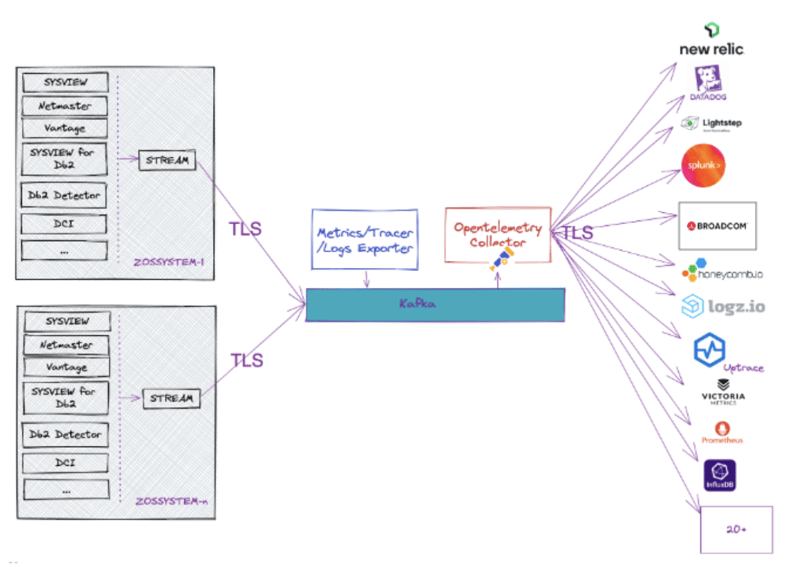
Embracing this standard will help to bridge the mainframe to the rest of the IT ecosystem by connecting its telemetry to over 30 OpenTelemetry supporting vendors.
Again, just like in the distributed and hybrid cloud spaces, this translates into increased choice, increased agility, reduced vendor lock-in, shorter time to value, and better visibility for mainframe customers and applications.
An additional benefit for the mainframe is that, by embracing OpenTelemetry, we can send telemetry data to multiple back-ends simultaneously without increasing CPU consumption or network bandwidth on the mainframe. This is a key benefit since the choice of back-ends (e.g. Splunk, Datadog, etc.) is often dictated by the application or line of business—and many large customers run more than a few concurrently.
Stay tuned to future blog entries for more technical details, more mainframe benefits, and use cases. We would love to hear your feedback to guide our future efforts and blog topics in this space! It’s easy to get in touch with us—please fill out this form if you’d like to have a conversation on this or any topic relating to mainframe visibility.
In this blog entry, I hope we articulated what we think OpenTelemetry could mean to the mainframe ecosystem and to mainframe customers. Thank you for reading and please send us your thoughts!
Comments